
Capital Allocation Snapshot: Union Pacific

For this weeks Capital Allocation Snapshot I am taking a look at the railroad giant Union Pacific (UNP). Union Pacific is the second largest railroad in the US with 32,200 miles of rail operating in 23 states. Historically railroads were terrible investments. After deregulation and consolidation in the industry starting in the 1980s, railroads eventually became to be considered great businesses. In this post I will summarize UNPs capital allocation by looking at how the company deploys the cash generated by the business.
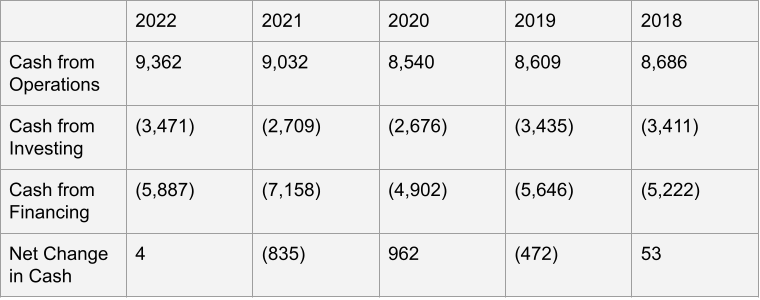
Cash Flow Summary
Before we can see how Union Pacific allocates their cash flow, we have to see how much cash they generate. UNPs cash from operations was flat from 2018-2020, hovering around $8.5B. The company produced a bit more cash in the following two years, ending up generating $9.3B last year. Union Pacific’s cash flow is largely consistent, with a slight up trend over the past five years. Interestingly, it does not appear UNP has had a large bump in profit due to the increased online shopping during the pandemic.
Union Pacific’s cash from investing is at the same point in 2022 as it was in 2018 coming in around $3.4B. Investment spend dipped about 20% during 2020 and 2021 to $2.7B.
Over the past five years, UNPs cash spent on financing has hovered around $5.5B, give or take a few hundred million. A decent increase was seen in 2021, with the company spending over $7B on financing activities.
Looking at the cumulative change in Union Pacific’s cash balance, we see the company has reduced its cash balance by around $450M.
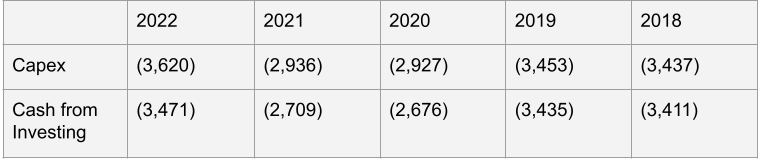
Cash from Investing
Union Pacific’s cash from investing section of their cash flow statement is pretty straight forward. The company had a few line items with very little spend, the large majority of expense being on capital expenditures. UNPs capex spend is pretty consistent being around $3.4B, then dipping during 2020-21.
Railroads are known for being pretty capital intensive since they always have to repair their huge networks of train tracks, hubs, and of course the trains. Comparing UNPs typical capex spend to their cash from operations shows the company usually spends about 40% of their cash flow on capex. This is a fairly high figure, but not as capitally intensive as I thought, there is still plenty of leftover cash to be spend on shareholder returns.
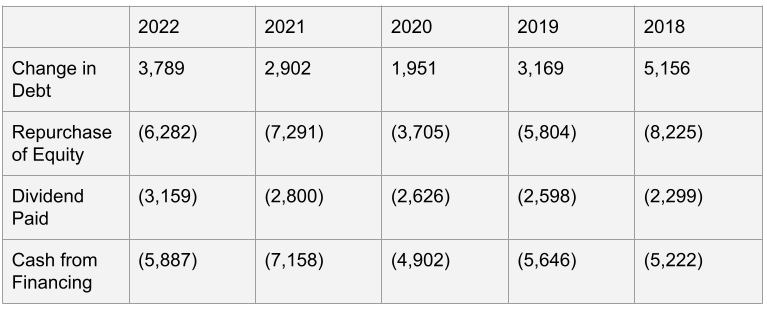
Cash from Financing
The first thing to notice from Union Pacific’s cash from financing is that every year in the last five they have increased their debt. The peak was in 2018 with an increase of $5B in debt, with the lowest figure coming in 2020 around $2B. UNP has a debt to equity ratio of 2.5, and a debt to EBITDA ratio of 2.5. Both of these debt ratios are moderately high, but not egregious if the company has stable cash flows.
The next line item is UNPs share repurchases, which have varied quite a bit since 2018. Peak buybacks occurred in 2018 with $8.2B, followed by 2021 at $7.3B. The buybacks in 2019 and 2022 are closer to the average for the period, being about $6B. UNP must have been trying to be conservative in 2020 in curtailing their buybacks a bit.
The interesting thing about the scale of these buybacks is that in 2018 UNP spent almost all of their cash from operations on share repurchases. Looking at this ratio for 2021 shows UNP spending about 80% of the cash flow on buybacks. This is a very large payout to shareholders and we haven’t even gotten to the dividends yet.
Union Pacific’s dividends have been steadily increasing over the past five years. The dividend grew around 12% year over year in 2019 and 2022. The other years showed less growth in the dividend paid. It is clear that UNP likes to consistently increase their dividend, while buying back stock in a more discretionary manner.
Taking a closer look at the cash that UNP is returning to shareholders, we see that they consistently payout more cash in dividends and buybacks than the cash generated from operations. Additionally, the company has to spend a few billion a year in capex. To meet the shortfall in cash, Union Pacific in constantly issuing more debt. Depending on how you look at it, UNP is returning all its cash from operations to shareholders then issuing debt to fund its capex. Or the company is raising debt to fund its large buybacks.
Conclusion
The main capital allocation story with Union Pacific is that they return all (or more) of their cash from operations to shareholders while also funding capex with debt. UNP is not the only company that does this. Many large, quality companies such as UNP have very high payout when it comes to shareholder returns partially funded by cheap debt. I am not really a fan of this type of capital allocation since at some point the company may have too much debt so it can not issue more, could have trouble servicing the debt in a recession, or will not have access to cheap debt if interest rates increase. That being said, if you would have jumped on board with UNP like 10 years ago when they started the issue debt and return lots of cash to shareholders program, then you would have achieved great returns from the stock.